 1 / 5
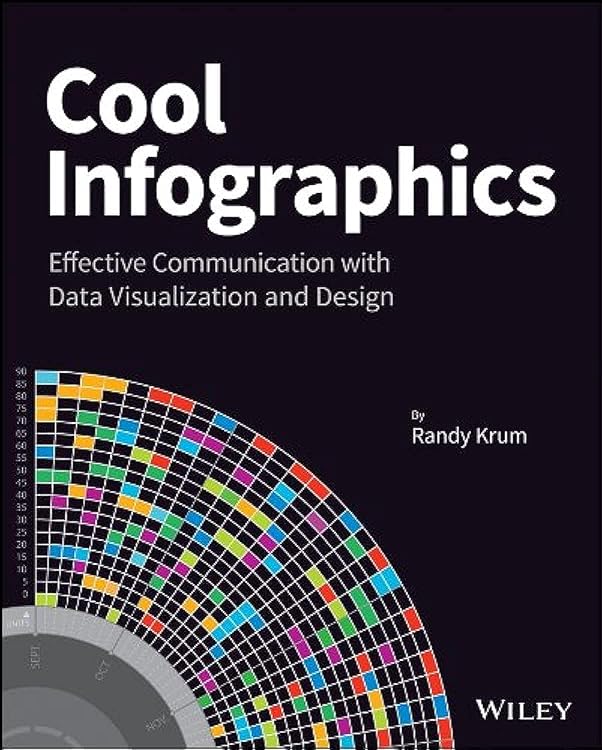
Cool Infographics: Effective Communication with Data Visualization and Design
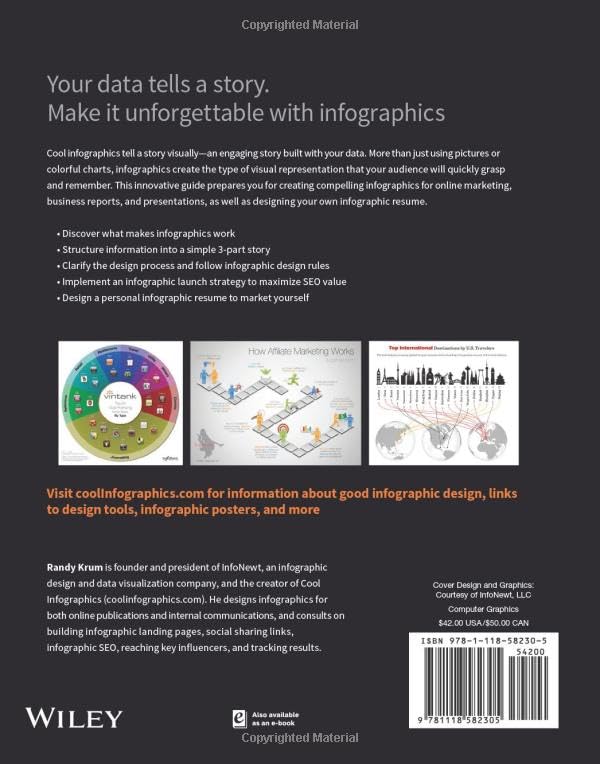
Effective Communication Visualization: Cool Infographics is a guide to communicating information through data visualisation and design. It covers infographic creation, software tools, online marketing, business uses and visual CVs, making it relevant to designers and professionals who need to present data clearly.
At a glance
- Explains the role of infographics and data visualisation in communication.
- Covers tools and techniques for creating infographics.
- Includes online marketing topics such as social media and SEO.
- Discusses visual CVs and business communication uses including reports and presentations.
Often bought together


Pros and cons
Pros
- Broad subject coverage spans design methods, software tools, marketing and business communication.
- The dedicated visual CV section gives job-seekers a specific application of infographic design.
- At 368 pages, the listing presents it as a substantial reference rather than a brief overview.
Technical specifications
9 specifications| Publisher | Wiley |
|---|---|
| Publication date | 5 Nov. 2013 |
| Edition | 1st |
| Language | English |
| Print length | 368 pages |
| ISBN-10 | 1118582306 |
| ISBN-13 | 978-1118582305 |
| Weight listed | 754 g |
|---|---|
| Dimensions | 18.8 x 2.03 x 23.11 cm |
Who is it for?
A good fit for
- Graphic designers learning to communicate data visually.
- Marketers creating online infographic content for social media or SEO.
- Business professionals preparing data-led presentations, reports or visual explanations.
- Readers interested in applying infographic design to a CV.
Less suited to
- Readers seeking a current software manual, as the listed first edition was published in 2013.
- Readers looking only for a collection of finished infographic examples rather than instruction.
Customer reviews on Amazon
- 5 stars
68% 68% - 4 stars
18% 18% - 3 stars
8% 8% - 2 stars
3% 3% - 1 star
3% 3%
Customer feedback describes the book as an accessible overview with useful tips and recommendations, and one customer notes a balance between theory and practice. Opinions on the illustrations are mixed. This makes the reported readability and practical coverage potentially useful to learners, while readers who prioritise the visual examples may want to account for differing reactions. The aggregate ratings lean positive overall but do not explain individual reasons for ratings.
Positive themes
- Customers report that the book offers a useful overview and practical tips.
- Customers describe the content as easy to read.
Mixed feedback
- Opinions about the illustrations differ.
Frequently asked questions
What topics does Cool Infographics cover?
The listing says it explains why infographics work and covers creation techniques, software tools, online marketing, business communication and infographic CVs.
Who is the book aimed at?
The listing identifies graphic designers, marketers and business professionals as intended readers.
Is the book focused only on design theory?
No. Its description says it covers both the design process and practical tools, and customer feedback describes a balance between theory and practice.
Is this a recent software guide?
The listed publication date is 5 Nov. 2013, so buyers looking for current software instructions should consider its age.
Alternative options

Manufacturing AI: Building the Data Foundation for the Next Industrial Revolution
£24.99

Design Thinking for Tech: Solving Problems and Realizing Value in 24 Hours (Sams Teach Yourself -- Hours)
£37.99

Product Analytics: Applied Data Science Techniques for Actionable Consumer Insights (Pearson Business Analytics Series)
£34.25

The Elements of User Experience: User-Centered Design for the Web and Beyond (Voices That Matter)
£35.62
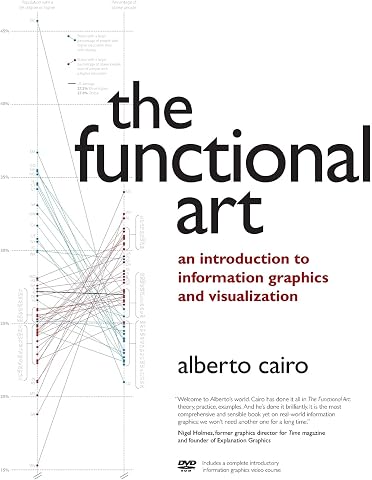
Functional Art, The: An introduction to information graphics and visualization (Voices That Matter)
£30.58

Digital Communications: Fundamentals and Applications (Communications Engineering & Emerging Technology Series from Ted Rappaport)
£98.93

Software Systems Architecture: Working With Stakeholders Using Viewpoints and Perspectives
£51.75
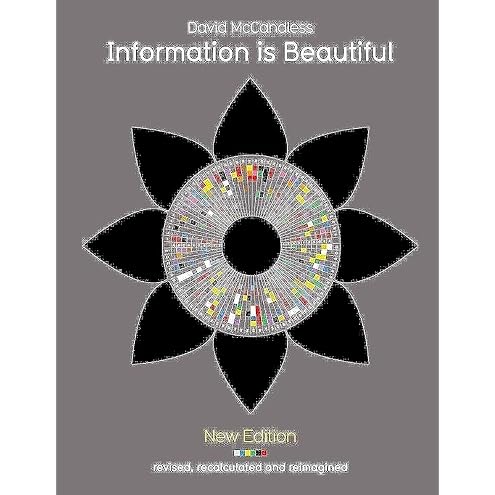
Information is Beautiful (New Edition): An Engaging Illustrated Guide to the World Through Updated Data Visualisations
£21.15
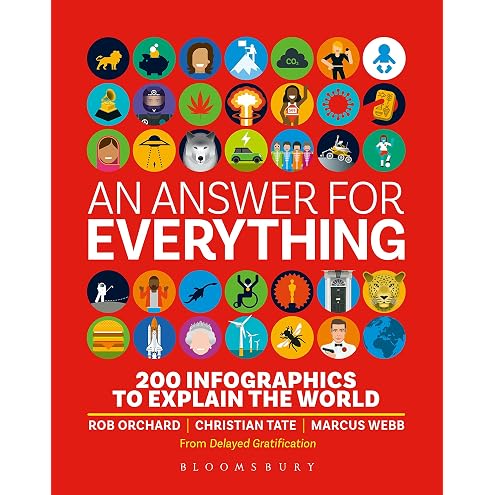
An Answer for Everything: 200 Infographics to Explain the World
£12.17
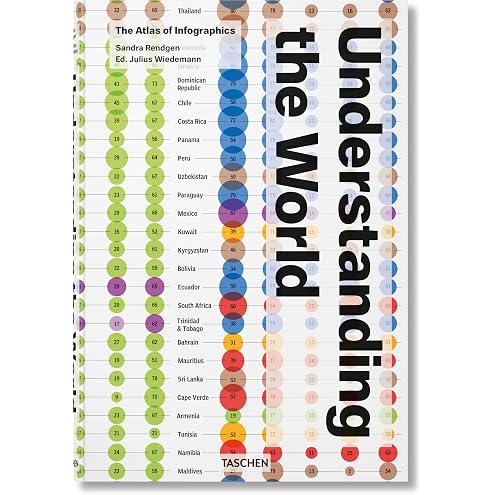
Understanding the World: The Atlas of Infographics
£39.99
Storytelling with Data: A Data Visualization Guide for Business Professionals
£19.70